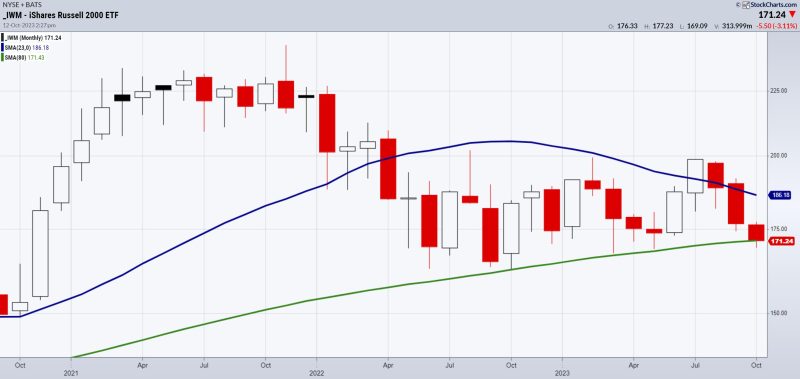
Investing in the stock market can be stressful and unpredictable. Many investors find themselves feeling overwhelmed by the constant fluctuations in stock prices and the ever-present risk of potential losses. However, it is possible to find some comfort in the stock charts.
Despite the unpredictability of the market, charts can offer a valuable glimpse into the past performance of a stock. Comparing the performance of past stocks to the current market can provide insight into how a stock might behave in the future. This can help investors make more informed decisions regarding their investments.
By using stock charts, investors can identify trends in a stock’s price as well as short and long-term opportunities. By tracking these trends, investors can take advantage of these trends for maximum profit. In addition, stock charts are a great way to identify entry and exit points, as well as the ideal time to buy or sell a stock.
In this video interview, Wall Street veteran, Howie Kay examines the comfort in the stock charts. He explains how analyzing the stock charts helps provide investors with an understanding of where the stock may be heading and how to best use this tool to maximize profits. He goes in-depth into the different types of charts and the various features within them.
Whether you are a seasoned investor or a novice, this interview gives tremendous insight into how comfort in the stock charts can be used to your advantage when investing in the stock market. By leveraging the information found on these charts, investors can identify the right time to buy or sell a stock, as well as spot trends and opportunities. All of this can help investors realize maximum profits from the stock market and become better, more informed investors.


