Title: Contrasting Perspectives: The Large Cap-Small Cap Debate through an RRG Lens
Introduction
In the world of investing, oftentimes the pivotal discussion circulates around two heavyweight contenders: Large-cap and Small-cap investments. The debate over which among the two offers superior yield potential, has been an ongoing narrative for investors both seasoned and new. Each has its unique appeal and fosters substantial returns under suitable market conditions. However, a substantial differentiator, which can provide a clear understanding of these two investment segments, is the Relative Rotation Graphs (RRG). Herein, we will delve into a direct comparison of these categories based on the insightful perspectives furnished by RRG.
Understanding Large Cap and Small Cap Stocks
Large-cap stocks represent companies with a market capitalisation of over $10 billion. Unsurprisingly, they often reflect established, stable companies such as Apple or Microsoft. On the other hand, small-cap refers to companies with a market cap ranging from $300 million to $2 billion. They usually represent newer businesses or those operating in niche markets.
These two categories come equipped with their respective pros and cons. Large cap stocks typically provide stability and consistent dividends, whereas small cap stocks, while riskier, offer investors higher growth potential.
RRG: An Indispensable Investment Tool
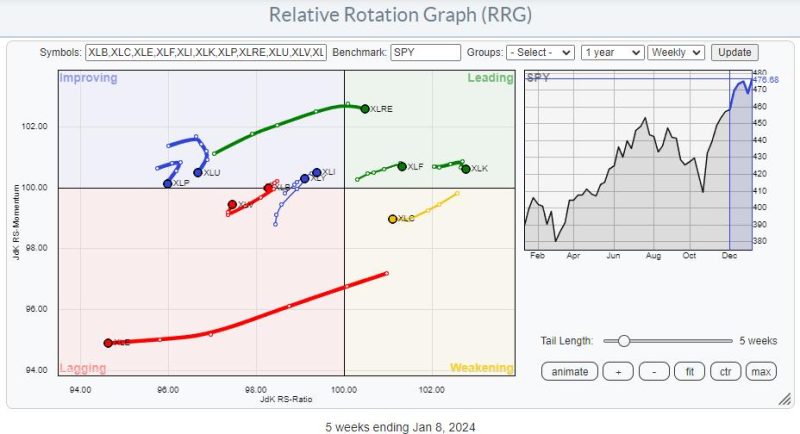
Relative Rotation Graphs or RRGs offer an innovative, dynamic view of market trends. This visual, comparative tool enables investors to apprehend the relative strength and momentum of numerous securities in a holistic manner. Essentially, RRGs aid in pinpointing the performance of assets or asset classes against a benchmark in a distinctive, quadrantal view.
Large Cap vs. Small Cap: An RRG Perspective
On the RRG, each investment option’s individual journey is tracked based on its strength and momentum against a chosen benchmark. By applying RRG to the large cap-small cap debate, it becomes distinctly illustrative of the contradictions in their performance characteristics.
During market upswings, when risk tolerance is high, small-caps typically travel into the leading quadrant on the RRG graph owing to their massive growth prospects. However, during turbulent periods, when investors seek refuge in established and stable entities, large caps migrate towards the leading quadrant, expressing their defensive market properties and relative strength.
Insights derived from RRG tool can be indicative of which cap segment is currently dominating the market. For instance, if large-caps are escalating towards the leading quadrant while the small-caps receding towards the lagging, it suggests that the market scenario may be favoring low-risk, stable stocks.
Final Words
The large cap-small cap debate is anything but one-dimensional. Each category has distinctive attributes that thrive in various market conditions, and using RRG helps expose these dynamics more effectively. As an investor, understanding and utilising RRG as a guide can be invaluable when navigating the complex terrain of the financial markets, which in turn, can optimise your investment strategy and decision-making process.
While RRGs provide stark comparisons and insightful visuals, it’s paramount that investors appreciate that investing is multifaceted. Therefore, while relying on such tools, it remains critical to consider other factors such as an investor’s own risk tolerance, market projections and the overall health of a company or sector. In essence, the Relative Rotation Graph, in the context of large cap-small cap debate, serves as a compass to guide but not define the entire journey.


