


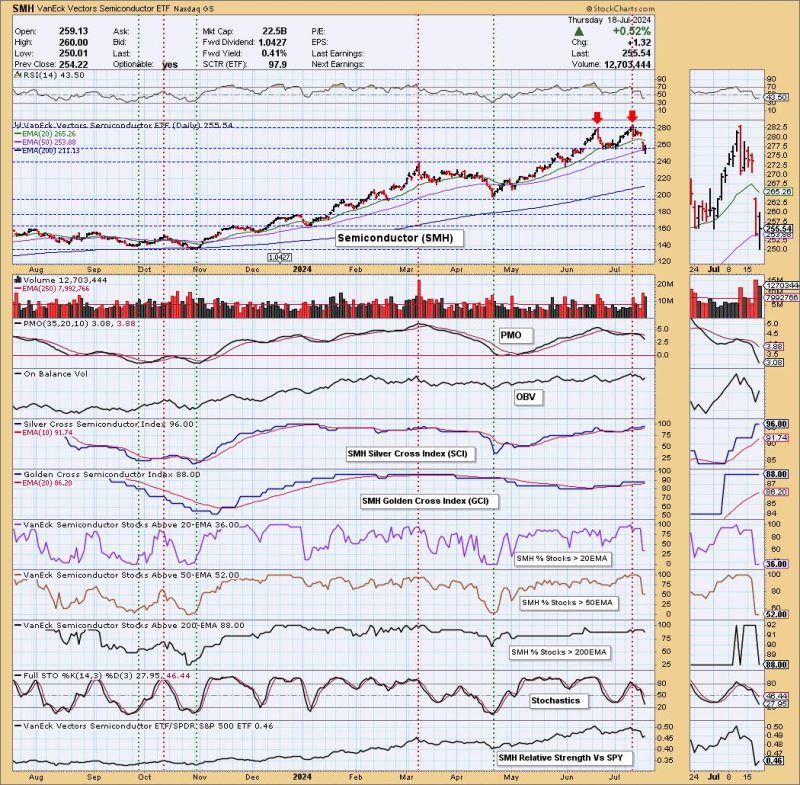
As we delve into the analysis of Double Top patterns, we’ll be focusing particularly on Semiconductors, specifically, the VanEck Vectors Semiconductor ETF (SMH). Noted for being a keen technical analysis tool, the Double Top pattern plays a crucial role in determining potential trends in price movements.
The Double Top pattern, as the name suggests, is a charting pattern characterized by a rise in price, followed by a moderate drop, then a rise again to the same approximate level as the first rise, and finally another moderate drop. This pattern essentially illustrates a situation where the price hits a certain high, retracts, and then hits the same high again before retreating. This creates two distinct ‘peaks’ that form the ‘double top’ and can be indicative of a possible future trend reversal from bullish to bearish.
In the context of the VanEck Vectors Semiconductor ETF (SMH), investors and traders often turn to technical analysis and patterns like the Double Top to predict future price movements. This is because SMH is regularly influenced by various factors like the market demand for semiconductors, advancements in technology, and global economic conditions. When SMH forms a Double Top pattern, it might signal a bearish reversal, indicating the potential for upcoming selling pressure.
The identification of a Double Top pattern with SMH begins with the observation of an upward trend in price movement. Subsequent to this, the price reaches a high point, forming the first ‘top’ then retracts to carve out what is known as the ‘valley’ or ‘trough’. When the price begins its upward trajectory again and reaches near the first top without breaking above it, it forms the second ‘top’, completing the ‘double top’. The ensuing price decline below the support level or the ‘neckline’ confirms this bearish pattern.
The application and interpretation of a Double Top is of utmost importance in the trading world as it helps traders to make informed decisions. When SMH shows a Double Top pattern, traders might consider it a suitable time to sell or short sell their holdings, anticipating a future drop in prices. Meanwhile, potential investors might view it as an opportunity to buy SMH at a lower price point once the stock price has decreased adequately following the pattern’s formation.
It’s critical to note that while the Double Top pattern can be a beneficial guide, it is not infallible. The pattern is essentially a probability design that indicates a likely outcome, but does not